What the Options Market Thinks About Earnings

Use Your Interactive Brokers Trader Workstation to See What the Options Market Thinks About Earnings Expectations
During earnings season, investors become justifiably concerned with analysts’ expectations for a company’s earnings and revenues. While analysts’ estimates provide an important framework for decision-making around an earnings release, options markets offer a subtle view into the market’s expectations about potential moves. Fortunately, your Trader Workstation (TWS) gives you some clarity on what the options market is thinking.
We will be using Royal Bank of Canada (RY) as an example. All the data used are from Thursday, August 20, 2020, a few days before the company’s August 26 earnings release. While the strikes and pricing apply specifically to that stock on that day, the methodologies that we discuss can be applied almost universally.
Options markets signal which way they expect the stock to move after the earnings release. The simplest way to see that anticipated move is to look at the nearest-term at-the-money straddle. Here’s a recent snapshot for RY:
Chart 1: Snapshot of Weekly, At-the-Money Strikes Nearest RY earnings release:
![]()
Source: Interactive Brokers
I’ve displayed the weekly 97.5 strike calls and puts that expire on Friday, August 28. The midpoint of those options, minus any intrinsic value, quickly gives us an idea of the implied move of the stock. In this case, that’s $2.32 (1.15 + 1.265 – (97.5 – (97.42-97.39)/2)), or about 2.38% (2.32 / 97.405). Another way to do that is to take the average of the implied volatilities, which are displayed in annualized terms, and convert them to daily volatilities by dividing by 16. You will see that those numbers generally agree if the options are very short-lived. (For a more detailed explanation of the “Rule of 16”, please read this link.)
This technique has its shortcomings, though. For starters, it becomes hard to do manual calculations if the stock moves around quickly. Also, using the straddle in this way ignores the subtleties of time decay, especially if there are several days until the options expire – which is the case here. This is where the more sophisticated analytical tools of the TWS become extraordinarily helpful. Note the following example for RY, which was created using the Multi-Expiry skew tool (Analytical Tools -> Options Analysis -> Volatility Skew -> Multi-Expiry Skew). I typically find it most useful to look at the nearest expirations with significant volume, so I clicked on the “+” button to bring up the next two weekly expirations (August 28 and September 4) and the next monthly expiration (September 18).
Chart 2: Graph of Near-Term Implied Volatilities in RY:
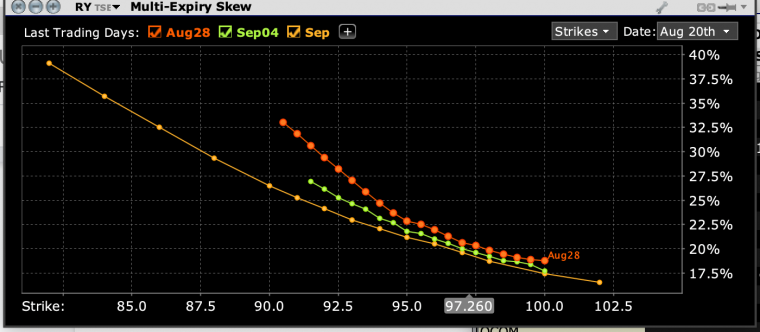
Source: Interactive Brokers
Options traders often refer to graphs like this as “smiles”, because near‑money options tend to have lower implied volatilities than their out‑of‑the‑money counterparts. The smile is usually lopsided, because traders tend to fear downside rather than upside, and because there are more natural writers of out‑of‑the‑money call options (particularly covered calls) than there are of out‑of‑the‑money puts. We can see that, in the short term, traders are fearful of a downside move in RY after earnings, where the weekly out‑of‑the‑money puts have an implied volatility about 5 points, or 20%, higher than those of the at-the-money puts.
We can get another helpful picture by using the Probability Lab (Analytical Tools -> Option Analytics -> Probability Lab). The static picture displayed below doesn’t do justice to what it can do when we use it live, but the implied probabilities for the weekly options are telling nonetheless:
Chart 3: Probability Distribution of RY Options Expiring August 28th:
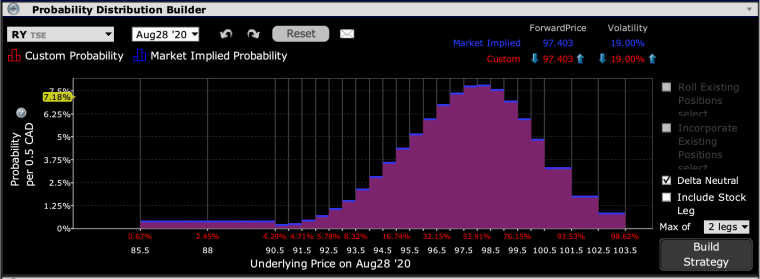
Source: Interactive Brokers
In this view, the option markets are implying peak probability for relative stability, with the highest levels displayed in the 97.5-98 range. The curve is fatter on the downside, however, which makes sense considering the downside skew that we saw in the implied volatility curve above. This curve is likely to change as the earnings date approaches, though. Many options buyers prefer to wait until the last minute to avoid spending money on decaying options, while the results of the banks that report earlier that week could affect sentiment toward Royal Bank.
There are many subtleties about trading and pricing options ahead of a company’s earnings release. Yet even a cursory understanding of the powerful tools available to users of the Interactive Brokers Trader Workstation will allow even relatively novice investors to get a richer picture of their holdings as they anticipate the release of important corporate data.
The author is a senior officer of an affiliate of Interactive Brokers Canada Inc. (IBC), an approved participant of the Bourse de Montréal Inc. (MX) and a clearing member of the Canadian Derivatives Clearing Corporation (CDCC). Nothing in this article should be considered an investment or trading recommendation by IBC or any of its affiliates. Trading in options, is highly speculative in nature and involves a high degree of risk. Before trading options listed on the MX and issued by the CDCC, one should read and fully understand the current CDCC disclosure document entitled “The Characteristics and Risks of Listed Canadian Options”.
Chief Strategist, Interactive Brokers
Steve Sosnick is the Chief Strategist at Interactive Brokers. He also serves as Head Trader of Timber Hill, the firm’s trading division, and is a Member of Interactive Brokers Group, the firm’s holding company. Steve has held numerous roles in the organization since joining Timber Hill in 1995 as Equity Risk Manager and Options Market Maker. He led the firm into Canada in 1998 and managed Timber Hill Canada from its inception. Much of Steve’s career was spent quietly developing and implementing algorithmic and electronic trading strategies for stocks and options before moving into a more visible role as the firm’s Chief Options Strategist and later as Chief Strategist. Steve has guest-authored several columns in Barron’s and makes regular live appearances on Bloomberg TV and Radio, as well as Yahoo Finance. He has held board memberships at various stock exchanges, serving as a board member of CBSX, NSE and ISE-SE. In Canada, he is a member of the MX Regulatory User Group and the IIAC Derivatives Committee. Prior to joining Interactive Brokers, Steve held senior trading roles at Morgan Stanley, Lehman Brothers, and Salomon Brothers, where he completed the firm’s famed training program. He holds both an MBA in Finance and a BS in Economics from The Wharton School of the University of Pennsylvania.
The information provided on this website, including financial and economic data, quotes and any analysis or interpretation thereof, is provided solely for information purposes and shall not be construed in any jurisdiction as providing any advice or recommendation with respect to the purchase or sale of any derivative instrument, underlying security or any other financial instrument or as providing legal, accounting, tax, financial or investment advice. Bourse de Montréal Inc. recommends that you consult your own advisors in accordance with your needs before making decision to take into account your particular investment objectives, financial situation and individual needs.
All references on this website to specifications, rules and obligations concerning a product are subject to the rules, policies and procedures of Bourse de Montréal Inc. and its clearinghouse, the Canadian Derivatives Clearing Corporation, which prevail over the content of this website. Although care has been taken in the preparation of the documents published on this website, Bourse de Montréal Inc. and/or its affiliates do not guarantee the accuracy or completeness of the information published on this website and reserve the right to amend or review, at any time and without prior notice, the content of these documents. Neither Bourse de Montréal Inc. nor any of its affiliates, directors, officers, employees or agents shall be liable for any damages, losses or costs incurred as a result of any errors or omissions on this website or of the use of or reliance upon any information appearing on this website.
BAX®, CADC®, CGB®, CGF®, CGZ®, LGB®, MX®, OBX®, OGB®, OIS-MX®, ONX®, SCF®, SXA®, SXB®, SXF®, SXH®, SXM®, SXO®, SXY®, and USX® are registered trademarks of the Bourse. OBW™, OBY™, OBZ™, SXK™, SXJ™, SXU™, SXV™, Montréal Exchange and the Montréal Exchange logo are trademarks of the Bourse. All other trademarks used are the property of their respective owners.
© 2024 Bourse de Montréal Inc. All Rights Reserved.