Understand the “Rule of 16”

Professional options traders are really good at dividing and multiplying by 16. That seems like a weird skill, but it is a crucially important one for anyone who wants to fully understand the terminology used in options markets. No matter how you utilize options, the “Rule of 16” is critical for analyzing volatility, particularly for short-term options.
Whether you utilize options to trade, hedge or invest, you should be familiar with common volatility measures. Volatility is at the root of all options pricing. It is based on the statistical concept of standard deviation, which measures the dispersion of a security’s returns around its average. Stocks move up and down during each trading day, and one with larger up and down daily price moves would have a higher standard deviation. The dispersion of daily price movements, measured in percentage terms over a period of time, is the basis of the concept of volatility.
Implied volatility is a commonly discussed and observed statistic, with many vendors and brokerage platforms (such as Interactive Brokers’) displaying it alongside options prices. There are two features of implied volatility that tend to be poorly understood. First, it is a derived number – it is the last variable remaining in an options pricing model after accounting for the stock’s price, the option’s striking price and time to expiration, the stock’s expected dividends before expiration, and prevailing interest rates over the life of the option. Second, it is typically expressed in annualized terms. This where the Rule of 16 comes into play.
Table 1: Pricing Data for XIU 20 strike puts, expiring May 15th, 2020 from the MX End of Day Report for April 14, 2020
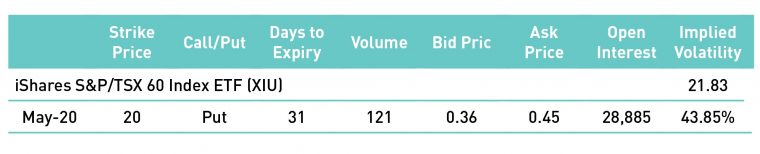
Source: MX
In the example above, the specific option is the 20 strike put on XIU expiring on May 15, 2020. Using the data in the table, with a closing price for XIU of $21.83, the 31 days to expiry and the midpoint of the strike’s bid/ask spread , which was $0.405 ((.36+.45)/2), the implied volatility was calculated to be 43.85% By that measure, the market is anticipating that XIU will have annualized movement over the next 31 days of about 44%. Unfortunately, an annualized measure is essentially meaningless to holders of an option that expires in about a month. The Rule of 16 is what allows us to place that implied volatility reading of 43.85% into a meaningful context.
There is a simple method for converting annualized volatility into daily volatility – divide the annualized number by the square root of business days in a year, which is normally just under 256. Coincidentally, that square root of 256 is 16, hence the rule. Using the example above:
43.85% / 16 = 2.74%
This means that the options market is anticipating that XIU will have an average daily up or down price movement of about 2.74% per day over the life of the option. With XIU trading at $21.83, that is roughly $0.60. It is far easier to visualize XIU moving up or down an average of 60 cents a day over the coming few weeks. Those who think that the market is understating the daily price movement should consider buying options at that current volatility level. Those with the opposite viewpoint should avoid buying those options and even consider selling them.
The Rule of 16 is especially useful just before companies release their earnings. Here is another line from the same MX End of Day Report:
Table 2: Pricing Data for TECK 12 strike calls, expiring April 24th, 2020 from the MX End of Day Report for April 14, 2020
| Strike Price | Call/Put | Days to Expiry | Volume | Bid Price | Ask Price | Open Interest | Implied Volatility | |
| Teck Resources Limited, Cl. B (TECK) | 12.32 | |||||||
| Apr-20 | 12 | Call | 10 | 10 | 0.68 | 0.75 | 185 | 67.67% |
Source: MX
The option displayed above is the 12 strike call on TECK.B expiring on April 24th, 2020. Teck Resources is scheduled to report earnings on April 23rd, just a day before that option expires. Using the methodology above, we can convert that 67.67% annualized volatility into a 4.23% daily volatility, or average daily movement of about $0.52. Since stocks often display greater volatility in the trading session after they release their earnings, it can be much easier for traders to visualize whether the market’s anticipated movement for Teck’s stock price seems adequate.
At this point you may be wondering why markets persist in expressing implied volatility in annualized terms, even though it is far less useful. Quite frankly it is an archaic market custom. The Black-Scholes model, which was the first widely adopted pricing mechanism for options, utilizes annualized volatility. In fact, it explicitly takes daily price moves and converts them into an annualized value. Prior to the emergence of Black-Scholes, options were a poorly understood corner of the investing universe, not the core component that they are now. Because that model was established using an annualized volatility measure, so did the options markets that sprung up in its wake. And that practice persists to this day throughout the industry.
It is my sincere hope that this article demystifies volatility terminology for many of you and gives you a better sense of how to better interpret an arcane number into real-world scenarios. With another quarterly earnings season approaching – one that is likely to bring added uncertainty – an understanding of the Rule of 16 should give you a stronger skill set for determining the options market’s outlook for post-earnings price moves.
The author is a senior officer of an affiliate of Interactive Brokers Canada Inc. (IBC), an approved participant of the Bourse de Montréal Inc. (MX) and a clearing member of the Canadian Derivatives Clearing Corporation (CDCC). Nothing in this article should be considered an investment or trading recommendation by IBC or any of its affiliates. Trading in options, is highly speculative in nature and involves a high degree of risk. Before trading options listed on the MX and issued by the CDCC, one should read and fully understand the current CDCC disclosure document entitled “The Characteristics and Risks of Listed Canadian Options”.
Chief Strategist, Interactive Brokers
Steve Sosnick is the Chief Strategist at Interactive Brokers. He also serves as Head Trader of Timber Hill, the firm’s trading division, and is a Member of Interactive Brokers Group, the firm’s holding company. Steve has held numerous roles in the organization since joining Timber Hill in 1995 as Equity Risk Manager and Options Market Maker. He led the firm into Canada in 1998 and managed Timber Hill Canada from its inception. Much of Steve’s career was spent quietly developing and implementing algorithmic and electronic trading strategies for stocks and options before moving into a more visible role as the firm’s Chief Options Strategist and later as Chief Strategist. Steve has guest-authored several columns in Barron’s and makes regular live appearances on Bloomberg TV and Radio, as well as Yahoo Finance. He has held board memberships at various stock exchanges, serving as a board member of CBSX, NSE and ISE-SE. In Canada, he is a member of the MX Regulatory User Group and the IIAC Derivatives Committee. Prior to joining Interactive Brokers, Steve held senior trading roles at Morgan Stanley, Lehman Brothers, and Salomon Brothers, where he completed the firm’s famed training program. He holds both an MBA in Finance and a BS in Economics from The Wharton School of the University of Pennsylvania.
The information provided on this website, including financial and economic data, quotes and any analysis or interpretation thereof, is provided solely for information purposes and shall not be construed in any jurisdiction as providing any advice or recommendation with respect to the purchase or sale of any derivative instrument, underlying security or any other financial instrument or as providing legal, accounting, tax, financial or investment advice. Bourse de Montréal Inc. recommends that you consult your own advisors in accordance with your needs before making decision to take into account your particular investment objectives, financial situation and individual needs.
All references on this website to specifications, rules and obligations concerning a product are subject to the rules, policies and procedures of Bourse de Montréal Inc. and its clearinghouse, the Canadian Derivatives Clearing Corporation, which prevail over the content of this website. Although care has been taken in the preparation of the documents published on this website, Bourse de Montréal Inc. and/or its affiliates do not guarantee the accuracy or completeness of the information published on this website and reserve the right to amend or review, at any time and without prior notice, the content of these documents. Neither Bourse de Montréal Inc. nor any of its affiliates, directors, officers, employees or agents shall be liable for any damages, losses or costs incurred as a result of any errors or omissions on this website or of the use of or reliance upon any information appearing on this website.
BAX®, CADC®, CGB®, CGF®, CGZ®, LGB®, MX®, OBX®, OGB®, OIS-MX®, ONX®, SCF®, SXA®, SXB®, SXF®, SXH®, SXM®, SXO®, SXY®, and USX® are registered trademarks of the Bourse. OBW™, OBY™, OBZ™, SXK™, SXJ™, SXU™, SXV™, Montréal Exchange and the Montréal Exchange logo are trademarks of the Bourse. All other trademarks used are the property of their respective owners.
© 2024 Bourse de Montréal Inc. All Rights Reserved.