A Quick Guide to Volatility and Options Skew

In my last article, entitled Understanding Vega, we examined how Vega measures the changes in option pricing relative to changes in implied volatility. In today’s article I will delve a little deeper into volatility and its impact across the options chain.
There are actually two types of volatility that option traders need to understand: Historical volatility and implied volatility. Historical volatility measures the movement of an underlying security over a specific period of time, typically one year, and is expressed as a percentage. It is recalculated with new prices each day. Investors often examine these past trading ranges to give them some insight into how much the underlying price may or may not fluctuate in the future; understanding that the historical price movements are not a guarantee of forward price. Historical volatility is a measure of that stock-price fluctuation. Standard deviation, another term investors should know, is a measure of how widely dispersed stock prices fluctuate from the average price.
Let’s look at an example:
XYZ is currently at $60
Volatility assumption 20%
Over the course of one year
XYZ to trade between $48 and $72 (±20%)
≈68% of time or 1 standard deviation
≈32% of time outside of this range
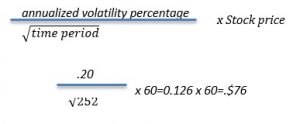
If we wanted to calculate the standard deviation for a shorter time period we could use the following formula:

In this example a 1 standard deviation move for a single day would approximate 76 cents and therefore XYZ would expect to trade from $49.24 to $50.76. Note, there are approximately 252 trading days in a calendar year.
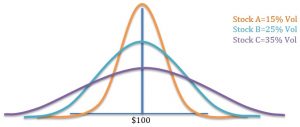
Now, let’s examine distributions of three stocks each with different volatilities. The mean price ($100) is identical for all three stocks, however, the greater the volatility, the greater the range of prices.

The stock, which experiences extreme price movements, will have higher premiums for options. If we think about this in the insurance world, we understand that higher volatility means higher insurance premiums. A homeowner in a flood zone (more volatility) is going to pay higher premiums for home insurance then the homeowner outside that zone. In the same vein, two teenagers driving the exact same Honda will have different insurance rates based on their historic driving records.
Implied volatility is the market’s forecast for the future movement of the underlying. It is reflected in the option premiums of puts and calls on the underlying security. Implied volatility reflects the supply and demand for each of those options.
Most traders active on the floors prior to 1987, myself included, lived under a false assumption that calls and puts at the same strike should trade for exactly the same price. What happened during the crash of 1987 changed forever the skewness of options. What everyone learned from the crash is that markets accelerate to the downside with much more velocity than they do to the upside. This made out-of-the- money puts more valuable than out-of-the-money calls. In addition, the advent of covered call strategies, managed both institutionally and individually, helped to push call option prices down, while the needs for portfolio protection pushed put prices upward.
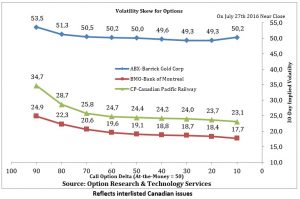
When we look at options volatility skew, we are looking at the differences in implied volatility across the options chain. The implied volatility will differ between out-of-the-money options, at-the-money options and in-the-money options and across differing expirations (Time skew). To see this in real time, go to the options calculator and pick any stock and look at the implied volatility differences between these options.
https://www.m-x.ca/marc_options_calc_en.php
If we were to graph the differences in the implied volatilities, we would get a smile or more accurately a smirk. The volatility smirk reflects higher implied volatility as options move more in-the-money or more out-of-the money.

Some final thoughts:
While pricing models and the statistics accompanying them can be very useful, they are not 100% accurate. There are several models available, all serve to give you guidelines. Know the risks and rewards of each trade you make, and most importantly of all, always have an exit plan!
CEO
Grigoletto Financial Consulting
Alan Grigoletto is CEO of Grigoletto Financial Consulting. He is a business development expert for elite individuals and financial groups. He has authored financial articles of interest for the Canadian exchanges, broker dealer and advisory communities as well as having written and published educational materials for audiences in U.S., Italy and Canada. In his prior role he served as Vice President of the Options Clearing Corporation and head of education for the Options Industry Council. Preceding OIC, Mr. Grigoletto served as the Senior Vice President of Business Development and Marketing for the Boston Options Exchange (BOX). Before his stint at BOX, Mr. Grigoletto was a founding partner at the investment advisory firm of Chicago Analytic Capital Management. He has more than 35 years of expertise in trading and investments as an options market maker, stock specialist, institutional trader, portfolio manager and educator. Mr. Grigoletto was formerly the portfolio manager for both the S&P 500 and MidCap 400 portfolios at Hull Transaction Services, a market-neutral arbitrage fund. He has considerable expertise in portfolio risk management as well as strong analytical skills in equity and equity-related (derivative) instruments. Mr. Grigoletto received his degree in Finance from the University of Miami and has served as Chairman of the STA Derivatives Committee. In addition, He is a steering committee member for the Futures Industry Association, a regular guest speaker at universities, the Securities Exchange Commission, CFTC, House Financial Services Committee and IRS.
The information provided on this website, including financial and economic data, quotes and any analysis or interpretation thereof, is provided solely for information purposes and shall not be construed in any jurisdiction as providing any advice or recommendation with respect to the purchase or sale of any derivative instrument, underlying security or any other financial instrument or as providing legal, accounting, tax, financial or investment advice. Bourse de Montréal Inc. recommends that you consult your own advisors in accordance with your needs before making decision to take into account your particular investment objectives, financial situation and individual needs.
All references on this website to specifications, rules and obligations concerning a product are subject to the rules, policies and procedures of Bourse de Montréal Inc. and its clearinghouse, the Canadian Derivatives Clearing Corporation, which prevail over the content of this website. Although care has been taken in the preparation of the documents published on this website, Bourse de Montréal Inc. and/or its affiliates do not guarantee the accuracy or completeness of the information published on this website and reserve the right to amend or review, at any time and without prior notice, the content of these documents. Neither Bourse de Montréal Inc. nor any of its affiliates, directors, officers, employees or agents shall be liable for any damages, losses or costs incurred as a result of any errors or omissions on this website or of the use of or reliance upon any information appearing on this website.
BAX®, CADC®, CGB®, CGF®, CGZ®, LGB®, MX®, OBX®, OGB®, OIS-MX®, ONX®, SCF®, SXA®, SXB®, SXF®, SXH®, SXM®, SXO®, SXY®, and USX® are registered trademarks of the Bourse. OBW™, OBY™, OBZ™, SXK™, SXJ™, SXU™, SXV™, Montréal Exchange and the Montréal Exchange logo are trademarks of the Bourse. All other trademarks used are the property of their respective owners.
© 2024 Bourse de Montréal Inc. All Rights Reserved.
