How to determine the best options strategy when buying or selling options?
This article is sponsored by TD Direct Investing.
If you were shopping for a new vehicle, would you pay the sticker price of a car that caught your eye without researching or looking into its features first? How would you know you were getting a fair deal, or if the car would even meet your needs? The same logic applies to trading options.
Before placing an option trade, it’s important to understand the factors that make up its price and how this price may change in the future. This can make it easier to determine the best option strategy to use and which option, or options, you may want to buy or sell. The active trading platform at TD, Advanced Dashboard, makes it easy to research and sort through this information when looking into an option trade.
The price of an option is the sum of two components – intrinsic value and extrinsic value. Extrinsic is also referred to as time value.
The intrinsic value is simply the amount the option is In-The-Money (ITM). For example, if you have a call option with a strike price of $50 and the underlying stock is currently priced at $55, the option is $5 ITM. However, the option is currently priced at $7. This additional $2 dollars is the extrinsic value.
Option value = ITM amount (intrinsic) + time value (extrinsic)
The extrinsic value is made up of three components: implied volatility, time to maturity, and sensitivity to interest rates. However, if interest rates are low, like they are now, they will have minimal impact.
Both implied volatility and time positively contribute to an option’s price. The more volatile the price of an underlying security can be, the higher the time value. The longer the duration of an option, the greater the time value is as well. All other things being equal, this is why an option that expires in 30 days has a lower premium than an option with the same strike price that expires in 120 days. Also, the more time to expiration, the greater the impact volatility has on an option’s price.
Because an option expires, its time value will eventually become zero. This is an important factor to remember when deciding which options to buy and sell. This decay of an option’s value from one day to the next is called theta.
The last term to know is delta. The delta of an option has no bearing on the price of the option itself, but it does represent how much you can expect the price of the option to change, given a $1 increase in price of the underlying security. For example, let’s say you have a call option with a delta of 50 cents. If the underlying stock moves up $1, then the option price should increase by 50 cents, in theory.
Now let’s apply some options pricing knowledge to the option chain. We will be using the active trading platform at TD, Advanced Dashboard, to demonstrate these scenarios. One of the benefits to using Advanced Dashboard is that we can customize an option chain and only show information that is relevant to us.
Let’s look at some examples:
- An option buyer, Jeff, has a goal to efficiently use his capital. In fact, he wants to focus on trades that offer the highest potential return on investment.
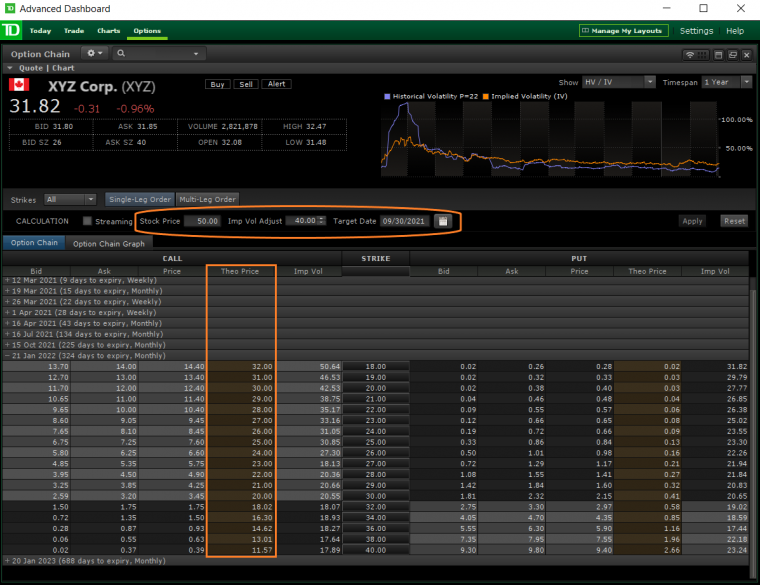
Jeff can use Advanced Dashboard’s theoretical pricing model to help predict the future prices of options. This pricing model is accessed by customizing the option chain columns. The model allows Jeff to provide theoretical values for underlying price, change in implied volatility, and a target date in the future. These inputs are then used by the model to calculate a theoretical value for the option at the target date, which is populated in the column of the option chain. This information can then be used to calculate a potential return on investment for a specific option trade. - An option seller, Emma, wants to generate a reliable source of additional income.
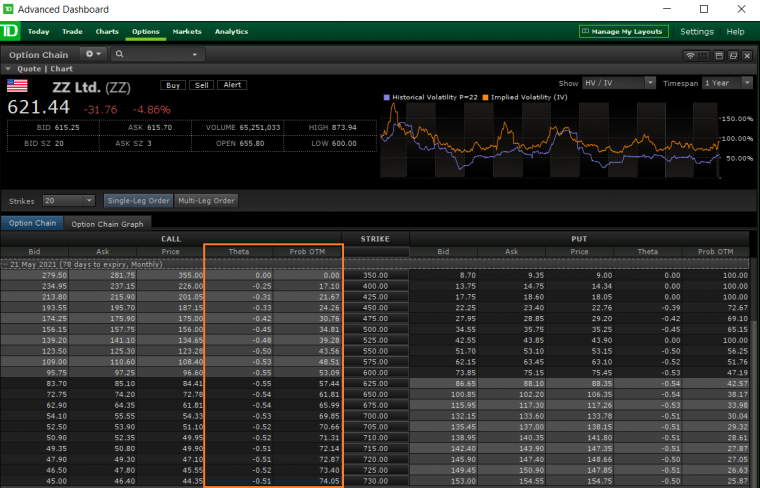
By comparing option premium and probability of expiring OTM, Emma can determine which trades best match her goal. She can use theta and the probability of the option expiring OTM to help estimate the monthly income of all her option positions. - An investor, Omar, has a large stock position and is worried about the stock price going down significantly after tomorrow’s earning announcement.
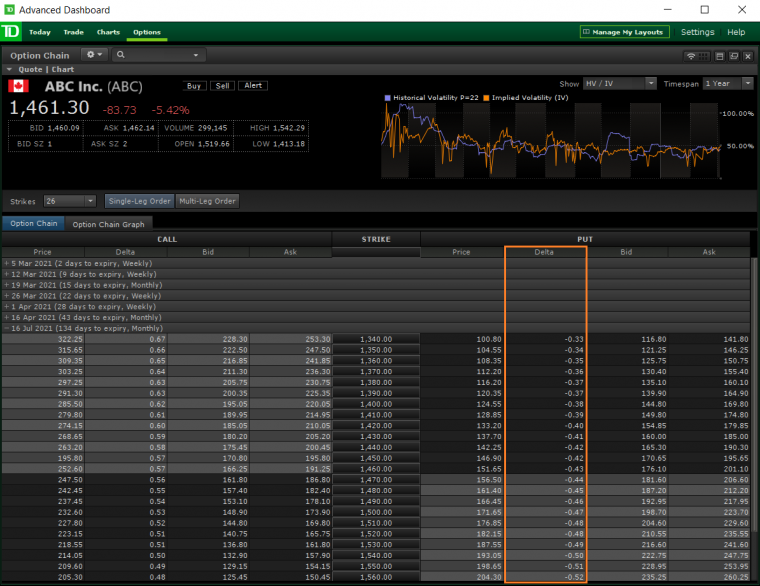
He can use the delta of an option to determine how many contracts he needs to buy to fully protect his stock position. Omar can then determine how much this protection is going to cost him. This process can be repeated for different strike prices to help determine which strike is the right balance between cost and protection. -
As you can imagine, there are many different trading goals and each one may require traders to focus on a specific set of data. Not only does Advanced Dashboard provide traders with this data, but it does so clearly and efficiently.
We’ve only covered the tip of the iceberg. If you wish to learn more about options pricing or trading options on Advanced Dashboard, take a look at the additional resources listed below.
Click here for an overview of TD Direct Investing’s Advanced Dashboard.
Dive deeper into the platform features and tools by registering for a live Master Class or watch our how-to videos on YouTube.
Disclaimer:
The strategies presented in this blog are for information and training purposes only, and should not be interpreted as recommendations to buy or sell any security. As always, you should ensure that you are comfortable with the proposed scenarios and ready to assume all the risks before implementing an option strategy.
Copyright © 2021 Bourse de Montreal Inc. All rights reserved. Do not copy, distribute, sell or modify this document without Bourse de Montreal Inc.’s prior written consent. This information is provided for information purposes only. The views, opinions and advice provided in this article reflect those of the individual author. This article is not endorsed by TMX Group or its affiliated companies. Neither TMX Group Limited nor any of its affiliated companies guarantees the completeness of the information contained in this publication, and we are not responsible for any errors or omissions in or your use of, or reliance on, the information. This publication is not intended to provide legal, accounting, tax, investment, financial or other advice and should not be relied upon for such advice. The information provided is not an invitation to purchase securities listed on Toronto Stock Exchange,TSX Venture Exchange and/or Montreal Exchange. TMX Group and its affiliated companies do not endorse or recommend any securities referenced in this publication. TMX, the TMX design, The Future is Yours to See., Toronto Stock Exchange, TSX, TSX Venture Exchange, TSXV, and Voir le futur. Réaliser l’avenir. are the trademarks of TSX Inc. Montreal Exchange, MX are the trademarks of Bourse de Montréal Inc. and are used under license. All other trademarks used herein are the property of their respective owners.
The information provided on this website, including financial and economic data, quotes and any analysis or interpretation thereof, is provided solely for information purposes and shall not be construed in any jurisdiction as providing any advice or recommendation with respect to the purchase or sale of any derivative instrument, underlying security or any other financial instrument or as providing legal, accounting, tax, financial or investment advice. Bourse de Montréal Inc. recommends that you consult your own advisors in accordance with your needs before making decision to take into account your particular investment objectives, financial situation and individual needs.
All references on this website to specifications, rules and obligations concerning a product are subject to the rules, policies and procedures of Bourse de Montréal Inc. and its clearinghouse, the Canadian Derivatives Clearing Corporation, which prevail over the content of this website. Although care has been taken in the preparation of the documents published on this website, Bourse de Montréal Inc. and/or its affiliates do not guarantee the accuracy or completeness of the information published on this website and reserve the right to amend or review, at any time and without prior notice, the content of these documents. Neither Bourse de Montréal Inc. nor any of its affiliates, directors, officers, employees or agents shall be liable for any damages, losses or costs incurred as a result of any errors or omissions on this website or of the use of or reliance upon any information appearing on this website.
BAX®, CADC®, CGB®, CGF®, CGZ®, LGB®, MX®, OBX®, OGB®, OIS-MX®, ONX®, SCF®, SXA®, SXB®, SXF®, SXH®, SXM®, SXO®, SXY®, and USX® are registered trademarks of the Bourse. OBW™, OBY™, OBZ™, SXK™, SXJ™, SXU™, SXV™, Montréal Exchange and the Montréal Exchange logo are trademarks of the Bourse. All other trademarks used are the property of their respective owners.
© 2024 Bourse de Montréal Inc. All Rights Reserved.