Butterfly on Shopify

Recently the Royal Bank of Canada lost its title as our country’s most valuable company in terms of market capitalization. For two brief weeks, Shopify sat at the top of the heap.
Chart 1: Royal Bank vs. Shopify May 31, 2020
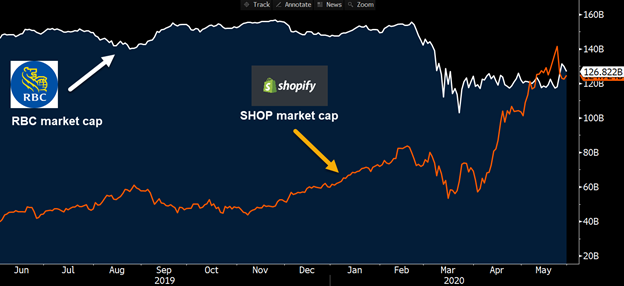
Source: Bloomberg
SHOP’s run has been a sight to behold.
Chart 2: Shopify (TSX:SHOP) May 31, 2020
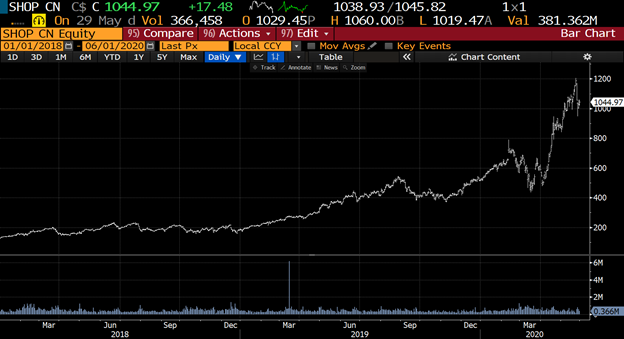
Source: Bloomberg
During the darkest moments of the corona crisis, SHOP shares changed hands at $435. Now, not even three months later, they are ticking above $1,000. The rise has been nothing short of remarkable.
But will this trend continue, or is SHOP due for a big pullback?
It is often difficult to time the exact moment that a strong stock like SHOP will correct. However, with a move as powerful as what we have seen over the past few months, the chances of SHOP simply going quiet are low. The bull move will most likely either continue to accelerate, or there will be a sharp and swift price correction.
But how should this scenario be played?
One interesting option strategy in this environment is to sell a PUT BUTTERFLY spread. This might sound complicated, but it really isn’t.
First let’s tackle what a long position in a put butterfly spread looks like. It consists of the following:
Where X = the middle strike and a = the equal distance to the outer strikes
| Long 1 put of strike X + a |
| Short 2 puts of strike X |
| Short 1 put of strike X – a |
Click on the following link to consult the Long Put Butterfly Strategy Guide:
https://www.m-x.ca/f_publications_en/strategy_long_put_butterfly_en.pdf
For our SHOP example, we will use X = 1,050 and a = 100.
This means our long SHOP butterfly will consist of:
Long 1 SHOP 1,150 put
Short 2 SHOP 1,050 puts
Long 1 SHOP 950 put
A long butterfly position will profit if future volatility is higher than implied volatility. The purchaser of the butterfly wants the underlying to expire at the level where he/she is short on the 2 puts. That is the point of maximum profit. As the price moves away from the strike, the profit eventually turns into a loss (but the maximum loss is limited to the spread between the strikes).
However, we just discussed how SHOP is likely to either continue higher on its tear or correct sharply. Therefore, a long butterfly is exactly the wrong position to implement in this situation.
But this means that a short butterfly is the ideal candidate to express our view. To understand the short put butterfly, consult the following strategy guide: https://www.m-x.ca/f_publications_en/strategy_short_put_butterfly_en.pdf
Here are the positions, using the mid-market prices as of May 29, 2020:
Table 1: Shopify Butterfly
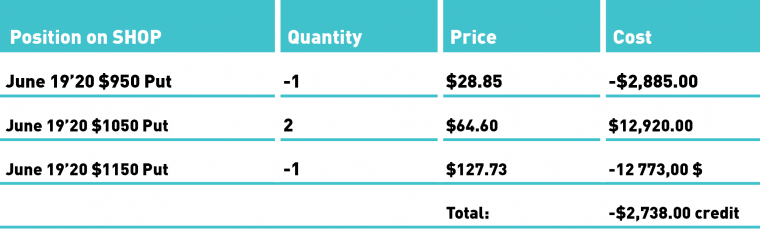
Source: Bloomberg
And this is what our P&L diagram looks like at various points before expiry, where the green line represents the potential P&L at expiration:
Chart 3: Shopify Payoff Profile Calculated as of a May 31, 2020 Start
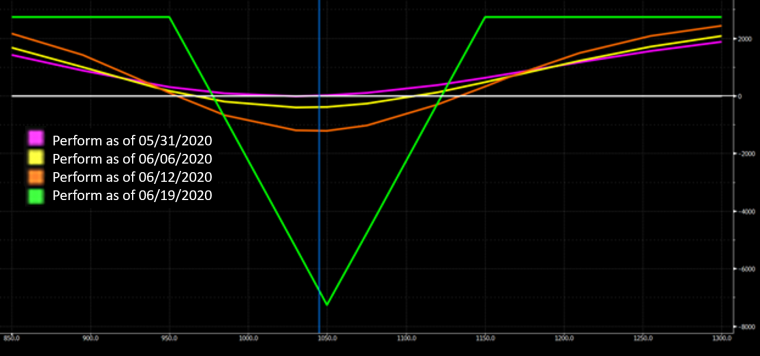
Source: Bloomberg
As you can see, the maximum loss occurs if SHOP stays at the current price. This maximum loss is the spread between the wings ($100.00), or $10,000 for every 1/2/1 butterfly combination, less the $2,738.00 credit received. This maximum loss would be $7,262.00.
However, SHOP moving above $1,150 or below $950 will result in our maximum gain, which is the total credit received of $2,738.00. Our breakeven ends up being anything below $977.38 or above $1,122.62.
Given the way SHOP is moving these days, this eventuality seems probable. But if you don’t agree, then the long butterfly position provides an easy way to take the other view.
The good thing about both long and short butterfly positions is that your risk is capped. You can construct specific payoff profiles depending on your view of where the underlying will be at expiration, while knowing your maximum gain and loss in advance.
Disclaimer:
The strategies presented in this blog are for information and training purposes only, and should not be interpreted as recommendations to buy or sell any security. As always, you should ensure that you are comfortable with the proposed scenarios and ready to assume all the risks before implementing an option strategy.
Derivatives Market Specialist
Big Picture Trading Inc.
Patrick Ceresna is the founder and Chief Derivative Market Strategist at Big Picture Trading and the co-host of both the MacroVoices and the Market Huddle podcasts. Patrick is a Chartered Market Technician, Derivative Market Specialist and Canadian Investment Manager by designation. In addition to his role at Big Picture Trading, Patrick is an instructor on derivatives for the TMX Montreal Exchange, educating investors and investment professionals across Canada about the many valuable uses of options in their investment portfolios.. Patrick specializes in analyzing the global macro market conditions and translating them into actionable investment and trading opportunities. With his specialization in technical analysis, he bridges important macro themes to produce actionable trade ideas. With his expertise in options trading, he seeks to create asymmetric opportunities that leverage returns, while managing/defining risk and or generating consistent enhanced income. Patrick has designed and actively teaches Big Picture Trading's Technical, Options, Trading and Macro Masters Programs while providing the content for the members in regards to daily live market analytic webinars, alert services and model portfolios.
The information provided on this website, including financial and economic data, quotes and any analysis or interpretation thereof, is provided solely for information purposes and shall not be construed in any jurisdiction as providing any advice or recommendation with respect to the purchase or sale of any derivative instrument, underlying security or any other financial instrument or as providing legal, accounting, tax, financial or investment advice. Bourse de Montréal Inc. recommends that you consult your own advisors in accordance with your needs before making decision to take into account your particular investment objectives, financial situation and individual needs.
All references on this website to specifications, rules and obligations concerning a product are subject to the rules, policies and procedures of Bourse de Montréal Inc. and its clearinghouse, the Canadian Derivatives Clearing Corporation, which prevail over the content of this website. Although care has been taken in the preparation of the documents published on this website, Bourse de Montréal Inc. and/or its affiliates do not guarantee the accuracy or completeness of the information published on this website and reserve the right to amend or review, at any time and without prior notice, the content of these documents. Neither Bourse de Montréal Inc. nor any of its affiliates, directors, officers, employees or agents shall be liable for any damages, losses or costs incurred as a result of any errors or omissions on this website or of the use of or reliance upon any information appearing on this website.
BAX®, CADC®, CGB®, CGF®, CGZ®, LGB®, MX®, OBX®, OGB®, OIS-MX®, ONX®, SCF®, SXA®, SXB®, SXF®, SXH®, SXM®, SXO®, SXY®, and USX® are registered trademarks of the Bourse. OBW™, OBY™, OBZ™, SXK™, SXJ™, SXU™, SXV™, Montréal Exchange and the Montréal Exchange logo are trademarks of the Bourse. All other trademarks used are the property of their respective owners.
© 2024 Bourse de Montréal Inc. All Rights Reserved.