A Twist on Risk Reversals

The past few months have been challenging for investors. During the first month of the coronavirus crisis, the stock market fell from record highs with unprecedented speed. Meanwhile, the subsequent rally has been just as befuddling to many.
Canada’s most liquid stock index ETF, the XIU, plunged from $27 to $17 (a loss of more than 37%) during the coronavirus-induced downturn before rallying back to $23.55.
Chart 1: iShares S&P/TSX 60 Index ETF (symbol XIU)
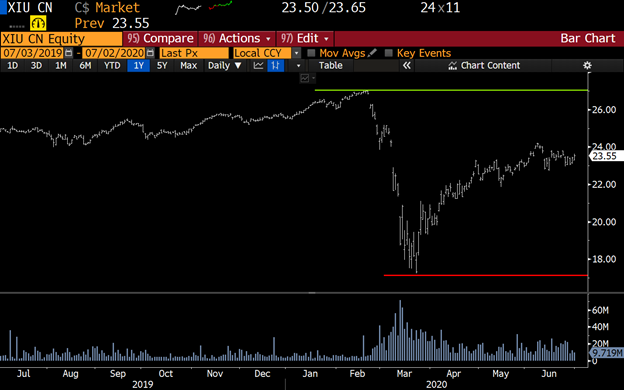
Source: Bloomberg
We are now stuck in the middle of the range, with no certainty as to what the next move will be.
What’s an investor to do?
One strategy to consider is letting the range work to our advantage by buying out-of-the-money calls while simultaneously selling out-of-the-money puts.
We can’t be sure the bull market has returned unless we break back above $27. Owning exposure on such a breakout is attractive.
At the same time, it’s always nice to buy an asset on the cheap. Many investors missed the $17 low, but luckily we can short $17 puts to take advantage of the possibility that the price might fall as much again. At that price, we will be forced to own it when we are assigned on our puts, but that’s fine. We want to buy the next dip.
This strategy is called a risk reversal and many investors execute this option spread strategy in equal contract amounts. However, due to the big difference in strike prices, this would result in dramatically unequal notional exposures. Buying XIU at $27 is much different than owning it at $17.
Therefore, we will construct this spread using equal notional amounts.
Using the long-dated March 18, 2022 option series, we get the following positions:
Prices as of the close of July 1, 2020:
BUY 50 Call XIU March 18, 2022 $27 strike @ $1.10
SELL 80 Put XIU March 18, 2022 $17 strike @ $1.16
Table 1: Option spread position table
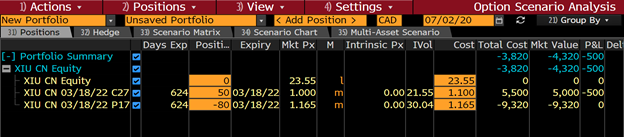
Source: Bloomberg
What’s interesting about this position is that it’s a net credit. That means if the stock market stays within the $17 to $27 range, we earn that credit.
It is also initially a positive theta position, with the time value decaying each day in our favour. This means that (all other variables being constant) the position would carry positively with the position holder if the XIU remains unchanged over the next month.
Table 2: Option Greeks for spread position on July 1, 2020
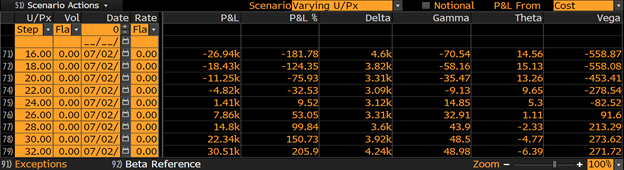
Source: Bloomberg
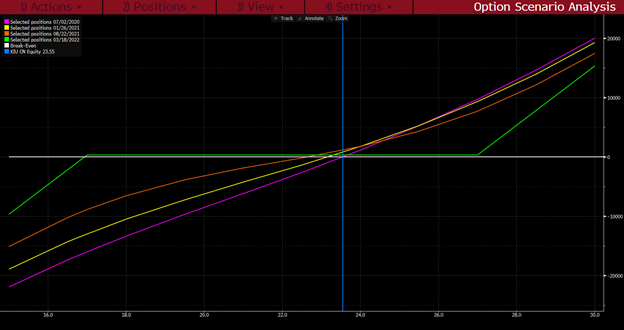
Here are the payoff profiles at various points in time.
Chart 2: Option spread position P&L curves through time (July 1, 2020 start)
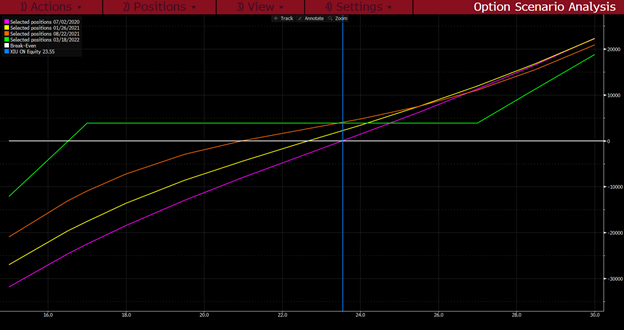
Source: Bloomberg
The green line represents the payoff profile on the day that the options expire.
As you will notice, it’s definitely a bullish trade, but one that produces a positive outcome even if the market remains unchanged at expiration.
If we were to execute this strategy using equal contract amounts (50 of each), the credit earned would be much less. The payoff profile would look like this:
Chart 3: Option spread position P&L curves through time for equal weighted spread (50 contracts of each strike) (July 1, 2020)
Source: Bloomberg
Notice how the green line (the P&L at expiry) is much closer to the zero mark.
The next time you execute a long-dated option strategy with varying strike prices, think about the fact that the notional values of the underlying are very different. Increasing the number of contracts so that the notional amounts are equal will change the nature of the option spread, while risking the same total number of dollars.
The risk reversal strategy shares many of the characteristics of investing, with a positive carry and a better risk profile if a market correction ensues. Note that, to implement this strategy as a retail investor, you will need to execute it in a margin account that is approved for selling puts. The broker will require margin as collateral for the short puts.
While this strategy is a little more advanced, it may be a good fit for investors who are looking to create a better payoff profile than a simple long equity position can offer.
Disclaimer:
The strategies presented in this blog are for information and training purposes only, and should not be interpreted as recommendations to buy or sell any security. As always, you should ensure that you are comfortable with the proposed scenarios and ready to assume all the risks before implementing an option strategy.
Derivatives Market Specialist
Big Picture Trading Inc.
Patrick Ceresna is the founder and Chief Derivative Market Strategist at Big Picture Trading and the co-host of both the MacroVoices and the Market Huddle podcasts. Patrick is a Chartered Market Technician, Derivative Market Specialist and Canadian Investment Manager by designation. In addition to his role at Big Picture Trading, Patrick is an instructor on derivatives for the TMX Montreal Exchange, educating investors and investment professionals across Canada about the many valuable uses of options in their investment portfolios.. Patrick specializes in analyzing the global macro market conditions and translating them into actionable investment and trading opportunities. With his specialization in technical analysis, he bridges important macro themes to produce actionable trade ideas. With his expertise in options trading, he seeks to create asymmetric opportunities that leverage returns, while managing/defining risk and or generating consistent enhanced income. Patrick has designed and actively teaches Big Picture Trading's Technical, Options, Trading and Macro Masters Programs while providing the content for the members in regards to daily live market analytic webinars, alert services and model portfolios.
The information provided on this website, including financial and economic data, quotes and any analysis or interpretation thereof, is provided solely for information purposes and shall not be construed in any jurisdiction as providing any advice or recommendation with respect to the purchase or sale of any derivative instrument, underlying security or any other financial instrument or as providing legal, accounting, tax, financial or investment advice. Bourse de Montréal Inc. recommends that you consult your own advisors in accordance with your needs before making decision to take into account your particular investment objectives, financial situation and individual needs.
All references on this website to specifications, rules and obligations concerning a product are subject to the rules, policies and procedures of Bourse de Montréal Inc. and its clearinghouse, the Canadian Derivatives Clearing Corporation, which prevail over the content of this website. Although care has been taken in the preparation of the documents published on this website, Bourse de Montréal Inc. and/or its affiliates do not guarantee the accuracy or completeness of the information published on this website and reserve the right to amend or review, at any time and without prior notice, the content of these documents. Neither Bourse de Montréal Inc. nor any of its affiliates, directors, officers, employees or agents shall be liable for any damages, losses or costs incurred as a result of any errors or omissions on this website or of the use of or reliance upon any information appearing on this website.
BAX®, CADC®, CGB®, CGF®, CGZ®, LGB®, MX®, OBX®, OGB®, OIS-MX®, ONX®, SCF®, SXA®, SXB®, SXF®, SXH®, SXM®, SXO®, SXY®, and USX® are registered trademarks of the Bourse. OBW™, OBY™, OBZ™, SXK™, SXJ™, SXU™, SXV™, Montréal Exchange and the Montréal Exchange logo are trademarks of the Bourse. All other trademarks used are the property of their respective owners.
© 2024 Bourse de Montréal Inc. All Rights Reserved.